Background Information
Monthly and Seasonal Forecasts
Summary
The outlook for fire weather severity is based on a comparison of the forecasted seasonal severity with the average severity as calculated by the Canadian Forest Fire Danger Rating System (CFFDRS). The two principal models within the CFFDRS are the Canadian Forest Fire Weather Index (FWI) System and the Canadian Forest Fire Behavior Prediction (FBP) System. The fire weather severity outlook focuses on components of the FWI System.

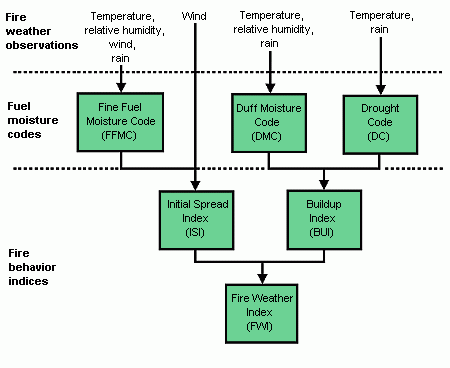
As shown in the figure above, the FWI System consists of six components that account for the effects of fuel moisture and wind on fire behavior (Van Wagner 1987). The first three components are the fuel moisture codes: the Fine Fuel Moisture Code (FFMC), the Duff Moisture Code (DMC), and the Drought Code (DC). These are, respectively, numeric ratings of the average moisture content of the litter and other fine fuels, of the loosely compacted organic layers of moderate depth, and of the deep, compact organic layers. High values indicate dry fuels. Only the DC is capable of carrying over fall moisture conditions into the spring.
The remaining three components – the Initial Spread Index (ISI), the Buildup Index (BUI), and the Fire Weather Index (FWI) – are fire behavior indices, that represent, respectively, the rate of fire spread, the fuel available for combustion, and the frontal fire intensity; their values rise as the fire danger increases.
The Daily Severity Rating (DSR) and its time-averaged value, the Seasonal Severity Rating (SSR), are extensions of the FWI System. The DSR is a transformation of the daily FWI value, calculated as follows:
Higher FWI values are emphasized through the power relation. The DSR can be accumulated over time as the cumulative DSR, or it may be averaged over time as the SSR:
where DSRi is the DSR value for day i, and n is the total number of days. The DSR can be averaged over a month as the Monthly Severity Rating (MSR). Values of 2 or more generally indicate severe fire conditions.
For this study, fire weather severity was evaluated by comparing the forecasted SSR (and MSR) to the average SSR (and MSR) as a ratio. The average SSRs for Canada were based on average weather conditions from 1971 to 2000 as calculated by the Canadian Wildland Fire Information System (CWFIS). In this case, weather conditions were averaged by station and day (e.g., average temperature, humidity, wind speed, and precipitation for April 1, April 2, etc., for Victoria, for Kamloops, etc.) to produce a time series of daily weather observations from April 1 to September 30 that were used to calculate fire conditions. Precipitation was summed and applied once per week (days evenly divisible by 7) to capture intermittent pattern, (otherwise, the average weather would produce drizzle amounts for every day). FWI System values were then calculated for each station for this artificial year of average weather.
The forecasted MSRs were created by systematically applying monthly anomalies (the difference between average and forecast) to each daily average weather value per station using the monthly and seasonal forecasts provided by Environment Canada. Currently, these forecasts include a probabilistic forecast for the next 4 months based on an ensemble approach and a 12-month extended-range deterministic forecast based on statistical techniques.
Monthly anomalies derived from these methods were collected for each of the weather stations used in this fire weather severity outlook. For temperature, the anomaly was added to each of the daily average values, whereas for precipitation, the anomaly was applied as a percent change to the weekly estimated rainfall. In the case of the probabilistic forecast, each ensemble was treated uniquely with respect to the weather time series, creating an ensemble of daily weather time series for each station. In turn, the FWI System calculations were applied to each time series to produce an ensemble of MSR values per month and final SSR values per station.

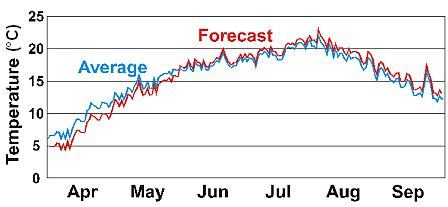
The figure above illustrates the application of seasonal anomalies. In the figure,
the blue line represents the average daily temperature in Edmonton for
each day from April to September. The perturbations are applied systematically
to each daily value according to Environment Canada’s seasonal outlook.
In this case, the temperatures for April and May are predicted to be below
normal; hence, the forecast line is below the average. Similarly, the
forecast for June through September is for above-average temperatures.
Note that the anomaly value varies from month to month, as can be seen by comparing
April’s anomaly to that of June and July.

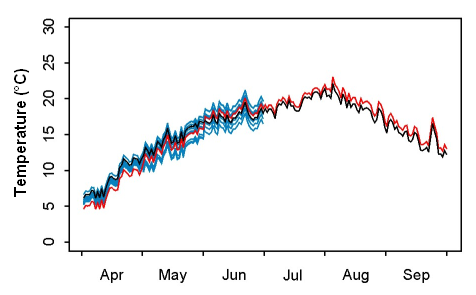
The figure above illustrates the calculations carried out for 10 ensemble members of one model used in the probabilistic forecast. The 30-year average weather series is shown in black, the individual ensemble member predictions are shown in blue, and the deterministic model prediction is shown in red. By treating each ensemble member separately, the spread of the predictions provides a measure of confidence in the forecast.
References
For additional information on fire-weather forecasting, refer to:
D.A. Harvey, M.E. Alexander and B. Janz. 1986. A Comparison of fire-weather severity in northern Alberta during the 1980 and 1981 fire seasons. The Forestry Chronicle 62: 507-513.
Anderson, K.R.; Englefield, P.; Carr, R. 2007. Predicting fire-weather severity using seasonal forecasts. In 7th Symposium on Fire and Forest Meteorology, Bar Harbor, ME, 23–25 October 2007. Am. Meteorol. Soc., Boston, MA
Van Wagner C.E. 1987. Development and structure of the Canadian Forest Fire Weather Index System. Canadian Forestry Service, Ottawa, ON. Forestry Technical Report 35. 37 p.
Monthly Forecast Severity Maps